There are topics so intuitively obvious to those of us who appreciate maps that I figure I must have discussed them previously. Gerrymandering is one of those. However, as I go through the site’s Complete Index, it’s doesn’t appear.
I won’t be making any value statements in this article. Rather I’ll focus on the weirdly twisted beauty of some of these occurrences. Then I’ll describe some of the probable strategies involved in their creation.
Gerrymandering is by no means unique to the United States. However politicians have elevated it to an art form here more precisely than probably anywhere else. For those in the international readership or who may need a civics refresher, Gerrymandering is the act of carving-up electoral districts in a way to benefit the political organization controlling the process.
This leads to the creation of districts that give the organizations an electoral advantage, puts the organization’s opponents at a disadvantage, or both. Gerrymandered districts often target key demographics such race, religion, class, language, or political affiliation for special attention, positive or negative.
Background
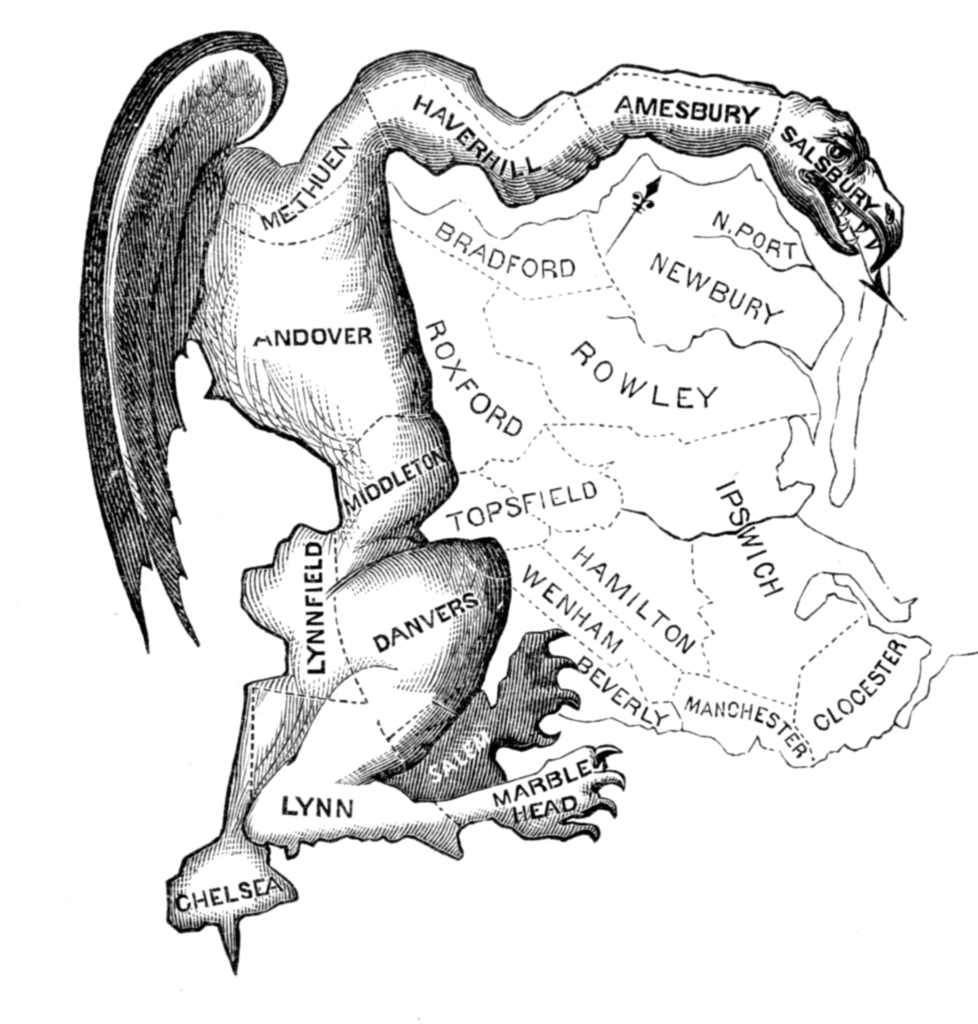
History
Gerrymander is a portmanteau, a word created from two other words crammed together. It’s a word mashup of “Gerry” and “Salamander.” created in 1812. Elbridge Gerry served as governor of Massachusetts and signed-off on a redistricting plan that benefited his political party, the Democratic-Republicans. Opponents considered one of them so oddly shaped that they claimed it resembled a salamander. A famous political cartoon lampooned the design and the name stuck. Its outline is almost quaint by today’s standards where computer-aided designs seek demographic advantage block-by-block.
U.S. Congressional Districts
While gerrymandering exists at all levels of United States government, I will focus on Congressional Districts for the House of Representatives. Those are particular brazen in their sophisticated demographic hairsplitting. The opportunity commonly arises after each Decennial Census — the last one in 2000 — although precedence does allow more frequent redistricting. In fact Congressional reapportionment was a fundamental purpose for the existence of the Census from the outset.
Only 435 Seats Available
There have been 435 members of the House of Representatives for the last several decades. Each state gets at least one representative regardless of population, and several have only that single representative. The remaining seats go to the states in proportion to their population. Overall, each district has an average population of about 650,000 people.
Shifts
Since the total number of representatives hasn’t changed much recently, the number of Representatives per state has shifted gradually to the south and to the west as the population migrates. Each state can decide pretty freely how to split the geographic apportionment of its representatives within a certain set of laws and court precedents. For example, they need to uphold proportional representation and various Civil Rights considerations.
That doesn’t stop states from trying though. The courts generally strike down a small number of particularly egregious examples after each major redistricting. Please note I’ve grossly oversimplified an extremely complicated process.
I’ve selected a few examples of potential gerrymandering. Sources for all of these images come from the National Atlas of the United States. I used the mapmaker tool layer for the 110th Congress by political party. Both major parties play this game. It’s not the exclusive domain of one or the other.
Illinois Stacked
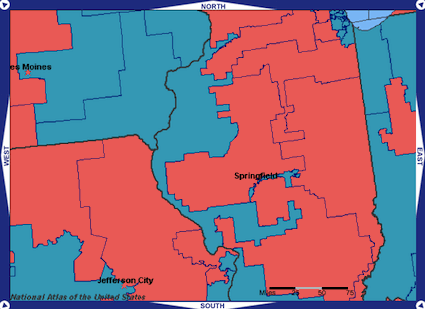
Stacking refers to shoving as many people of a particular demographic or persuasion into a single district as possible. Consider the tortured shape of the Illinois 17th Congressional District. It ambles along the western portion of the state and extends out with four arms to some of the more urban areas, including the state capital of Springfield. It has elected a representative from the Democratic party (blue). Notice that Republicans (red) represent all bordering areas of state. The 17th appears to have been bizarrely shaped to propel one more Democrat into the national-level House of Representatives.
North Carolina Stacked
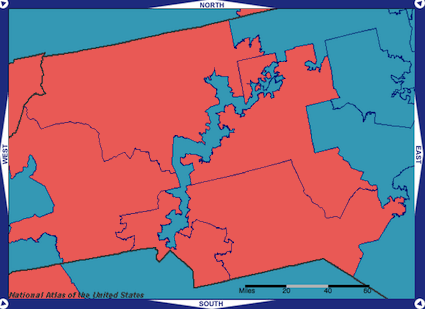
Stacking also exists in the North Carolina 12th Congressional District but for the opposite reason. Here the Republican party maintains control at the state level. So they created a diagonal gash through the heart of the state to mitigate their opponents. This district is a sacrificial lamb. They’ve conceded a district to their opponents to buttress their majority in the surrounding districts.
Originally they drew this district so skinny that its width narrowed down to the lanes of Interstate Highway 85 at points. The Supreme Court required another attempt, resulting in an improvement although hardly a “normal” shape.
Richmond Cracked
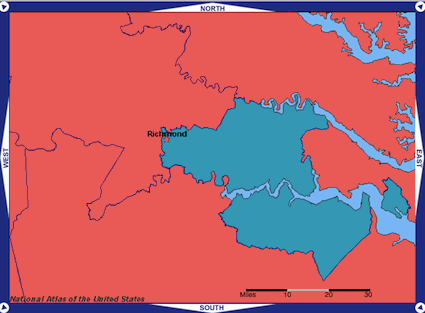
Cracking is another strategy usually found in urban areas. In this instance the Republicans divided the Richmond, Virginia metropolitan area into several districts. This dilutes the impact of the populace at its urban core. Richmond may be cracked or the one district may be stacked (or both).
New York City Protected
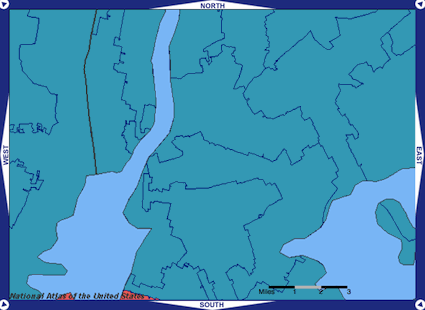
Gerrymandering doesn’t always favor one party over another. Politicians also use it to protect incumbents who wish to cement permanent margins of victory from challengers of either party. New York City is a stronghold of the Democratic party in vast swaths, Nonetheless, notice the bizarre patchwork of shapes. There doesn’t seem to be much incentive to gerrymander for political reasons so it may be for more personal reasons.
Iowa Competitive
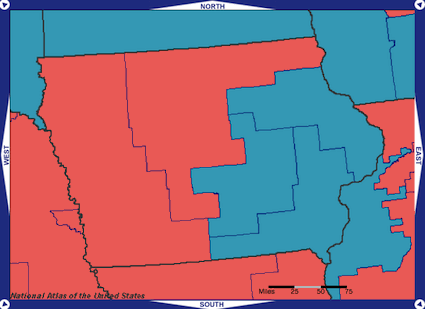
The increasing sophistication of gerrymandering has led to distressingly non-competitive elections. Some states are starting to rebel. Iowa is a primary example. Here a nonpartisan bureau of the state legislature determines the boundaries. The boundaries of these districts follow logical patterns and county boundaries. Some of the most competitive Congressional elections in the United States happen here as a result.

Leave a Reply