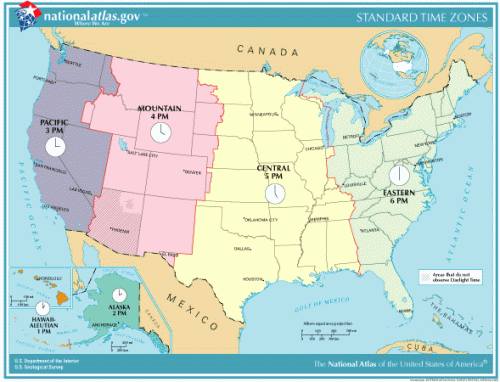
I’ve noted my appreciation for random visitors on many occasions. They serve as an amazing source of accidental topics. This time an anonymous lurker wished to find the easternmost extreme of the U.S. Central Time Zone. Why stop there, I figured? What are the extreme longitudes for each of the time zones in the Lower-48 states, Eastern, Central, Mountain and Pacific?
This wasn’t a tough prospect although it’s a bit more complicated than one might imagine. None of the major online interactive mapping sites includes a time zone layer. Mapquest used to incorporate that feature — I know that’s true because I produced screen grabs for an old article featuring time zone anomalies — but it discontinued it for some unknown reason. I had to use a lot of eye-balling and switching between applications to get around their deficiencies. I would be so much happier if I could combine the best of each mapping website into a single system.
Gathering Data
So I began with an image from the National Atlas of the United States that provided great hints and clues.

Then I could narrow it down further using the National Atlas’ Mapmaker Tool [no longer available], by turning on layers for Time Zone, County and County Name.
It’s self-evident that time zones don’t follow arrow-straight longitudinal lines for lots of good reasons. However they generally follow, with minor exceptions, either state or county boundaries. Turning on these layers helps one correlate points that feed into the next resource, Mapquest.
Mapquest displays county lines (unlike Google Maps — much to my ongoing annoyance!). Thus I can transfer the results of the National Atlas into a better interface. However, Mapquest has a fatal limitation: embedded maps look fine on the blog but they won’t display in certain newsreader software applications including Google Reader. More people use newsreaders to access Twelve Mile Circle than any other method so that’s a distinct problem. Readers would have to open another tab or window if they wanted to see the maps and I don’t want make people to do that if I can avoid it.
Creating a Map
I had to go through a third step, transferring lat/long coordinates from Mapquest into Google Maps so that the entire audience could view the results. It’s a bit of a pain but I only need to do it once. The results are interesting.
I’ve color-coded the extremes: dark blue for Eastern; red for Central; green for Mountain and light-blue for Pacific. It’s striking to see how the boundary extremes slip over each other. Notice how closely the easternmost point of Mountain Time comes to the westernmost point of Eastern Time, as an example.
Theoretically, one could drive between those two points and physically experience three distinct time zones in less than twelve hours. Take a track through North Dakota on the higher speeds of the Interstate Highway System and accomplish the same thing while subtract even more from the total. Add that to my list of potential future road trips!
I will explore each of the eight extremes (easternmost and westernmost points for each of the four time zones) in Part 2.

Leave a Reply